I had posted this information on a few sites, so I thought I would put it up here.
Alright, I've read all over about the power valve issue. Does it work? Does it make a difference? Any dyno hard results? etc., on and on.
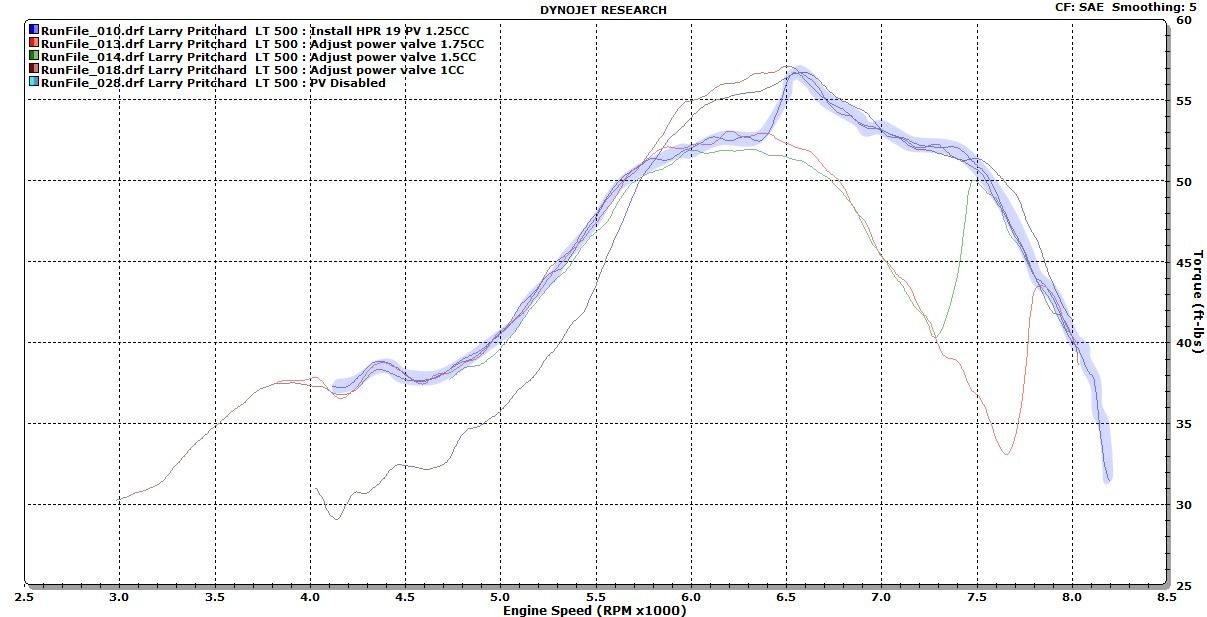
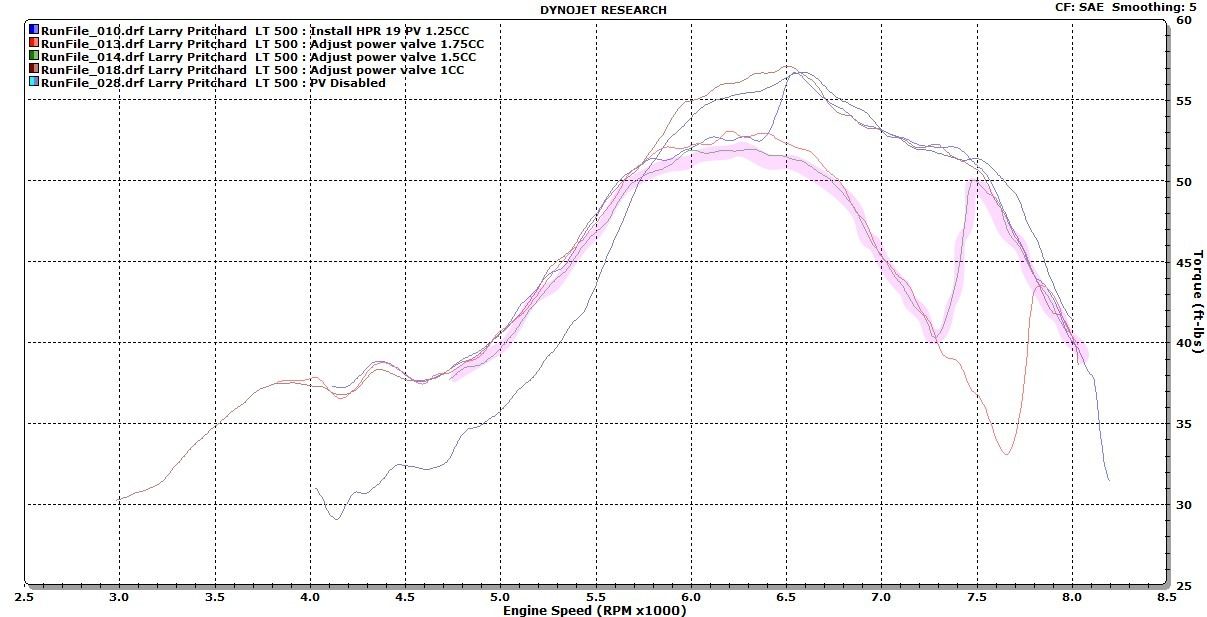
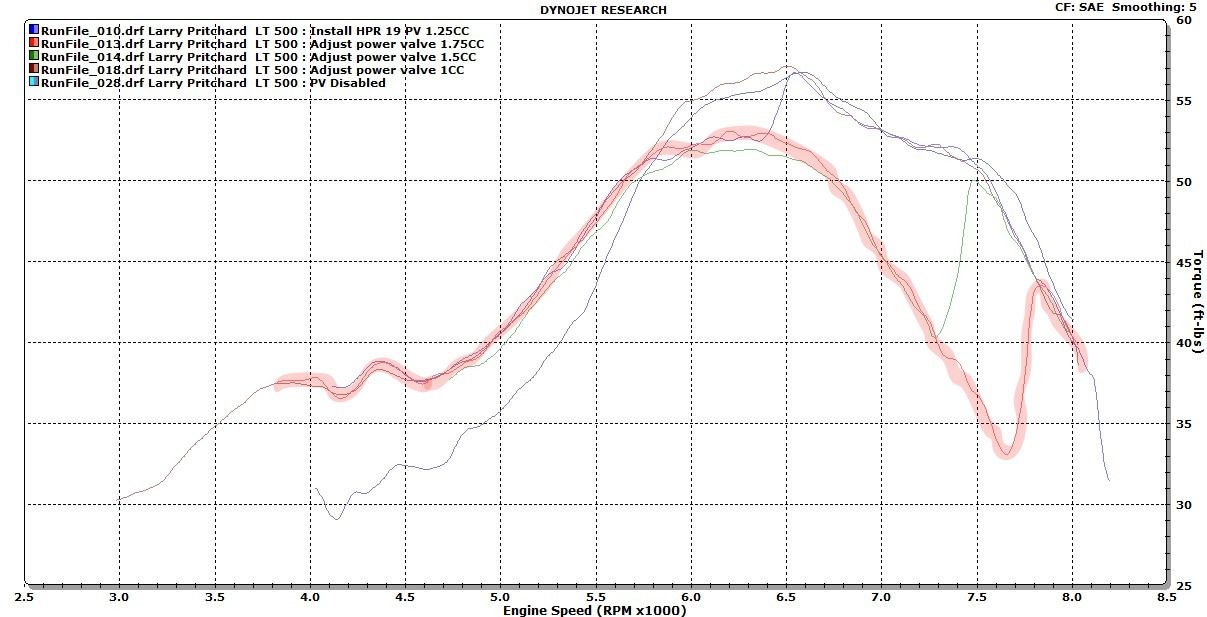
Well I have some dyno charts for my setup and we specifically were playing around with the PV setting. From blocked off thru 1.75CC (counter clockwise).
The following charts are for a HPR#19, taper bored TM38, dune porting, open intake, VF2 reeds. The charts show torque and I will not post Q vs HPR pipe HP numbers because those always get into pissing matches.
I just wanted to show that on the 500, the PV does impact your power curve. I've highlighted all curves since they are hard to read if I didn't.
FYI... I've heard and it makes sense to me that based on oil temp, the PV will open at different points. My test results for my engine seemed to like 1CC PV setting when running the Hall HPR#19.
These are Torque numbers only as I don't want these threads to start any HP wars.
PV blocked closed:
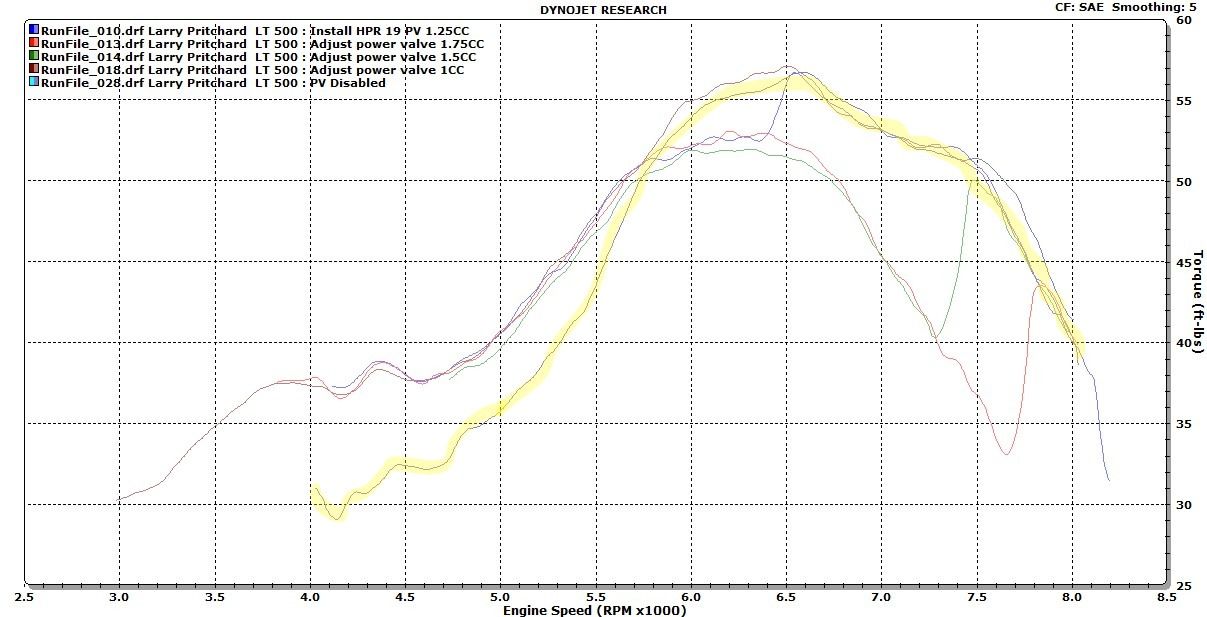
PV set to 1.25CC (Q pipe recommended setting):
PV set to 1.50CC:
PV set to 1.75CC:
PV set to stock 1.00CC (best for my bike):
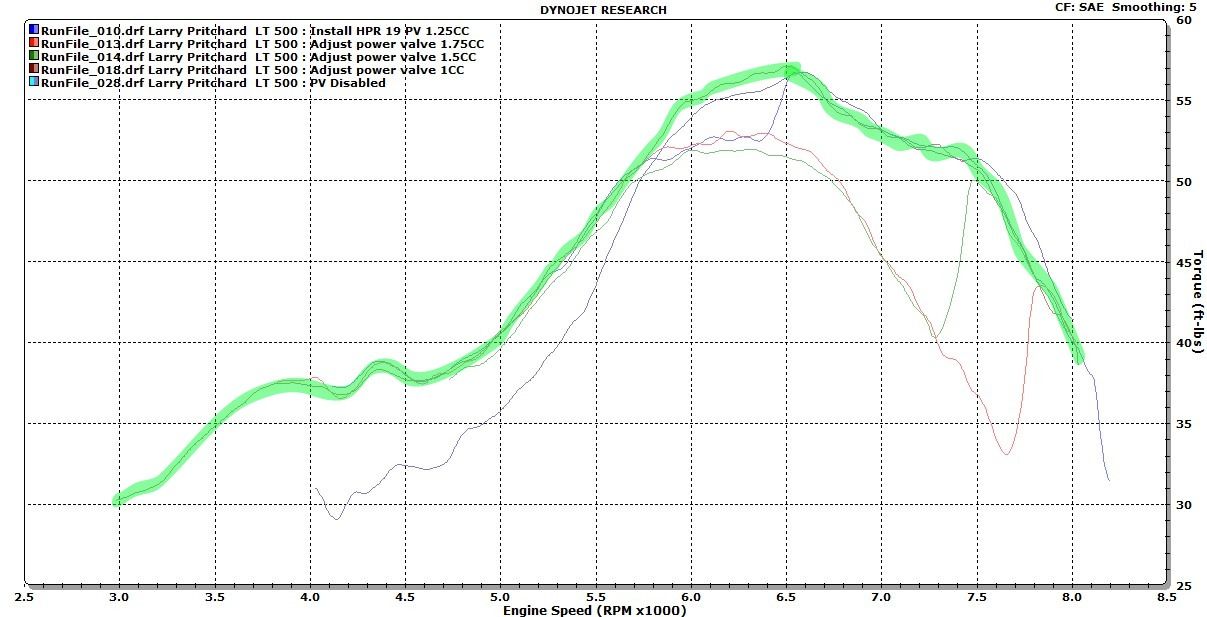
So in short, if your a drag racer running only WO, then blocking it off closed won't impact top end RPM / Power.
If you do anything else, it can greatly impact your power below 6k RPM.... you can even screw up and set it to 1.75CC or more and it will kill your top end.
EDIT 10/16 - Adding run info.
These were all from Hall's dyno in Phoenix, AZ on June 27th, 2011.
My Setup:
500 Fanatic - HRD porting (HRD rebuild completed 8/2010), Ears re-inforced
Head - Squish fixed & o-ringed
Trans - M102
B8ES .020 gap plug w/5k plug cap
OEM stator, coil, ECU, stock timing
HPR#19 Pipe
VP110 w/927 @ 20:1
TM38 bored to 41mm carb w/640 main
Open Intake w/ 4x8 Uni Dual Layer w/Outerwear
Q cut piston
Vforce2 reeds
Dyno Info: (Dyno tires used, Absolute Pressure: 28.5 in-Hg, Air Temp: 90.5* F (Outside temperature in Phoenix was 115* F), Humidity: 27%, Altitude: 1100 ft; engine warmed to same CHT for each pull set, multiple pulls taken to confirm curves)
Jerry Hall is adding a little more information for those that may have trouble understanding the graphs and what effect the power valve closing has on the power curve.
Graph # 1
Pale green line is the result of the power valve (PV) being closed through the whole RPM range
Graph # 2
Wide Blue line is the result of the PV closing @ 6400 to 6500 RPM
Graph # 3
Wide Pink line is the result of the PV closing @ 7300 to 7500 RPM
Graph # 4
Wide Pink line is the result of the PV closing @ 7600 to 7800 RPM
Graph # 5
Wide Green line is the result of the Optimum setting where the PV closes @ 5750
I also have some graphs of some PV tuning on a LT250R Suzuki. I will try to post them in the next few days when I get them transferred from the dyno computer.

